
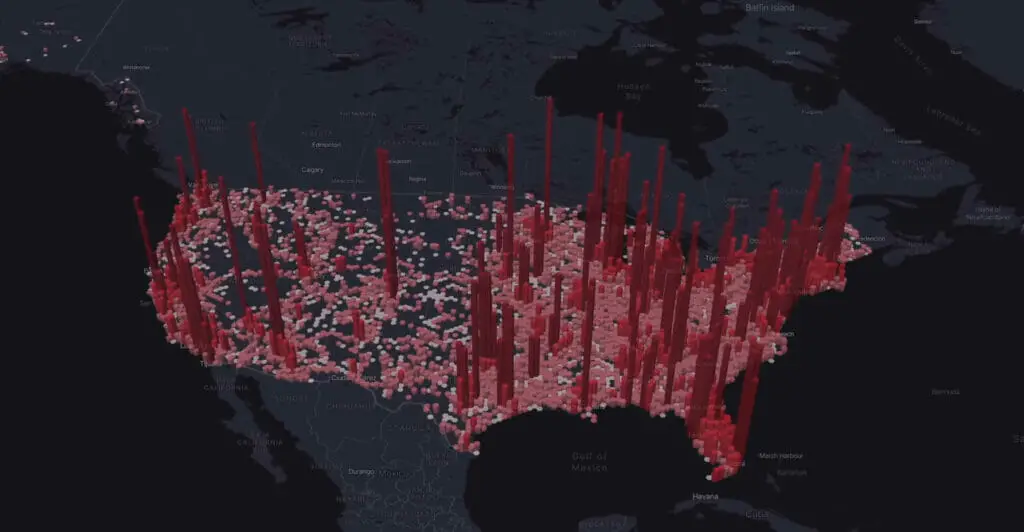
You want to know you’ve got a signal. That’s where telecom coverage maps come into play.
These maps are essential tools for anyone wanting to know the strength and range of their mobile signal. It represents signal strength across different regions, making it easier for users to understand where they can expect the best connectivity.
There are 3 methods to access these coverage maps:
- You can visit a service provider’s official website to access their most up-to-date and detailed coverage maps.
- Numerous online platforms aggregate and compare coverage maps from various providers, offering a broader perspective on network strengths.
- By visiting a telecom provider’s physical store, you can get hands-on demonstrations of coverage maps and ask representatives for tailored advice.
In this article, I’ll provide a detailed insight into USA Telecom Coverage Maps, breaking down what these maps mean for you as a consumer and how different providers stack up against each other across various regions.
Let’s talk more about this below.
Understanding Telecom Coverage Maps
Let’s take a moment to demystify telecom coverage maps. These handy tools visually represent the areas where you can expect to receive signals from different carriers. Essentially, they’re your guide to knowing whether you can make that important call or send that crucial email when you’re out and about.
Here are some key points about telecom coverage maps:
- The colors represent signal strength (green=strong; yellow=moderate; red=weak).
- Regular updates keep them accurate with network expansions and enhancements.
- ‘Coverage may vary’ acknowledges external factors influencing reception.
Major USA Telecom Providers and Their Reach
Let’s look closer at the biggest players in the US telecommunication industry. These giants have an extensive reach, but what does this mean for you?

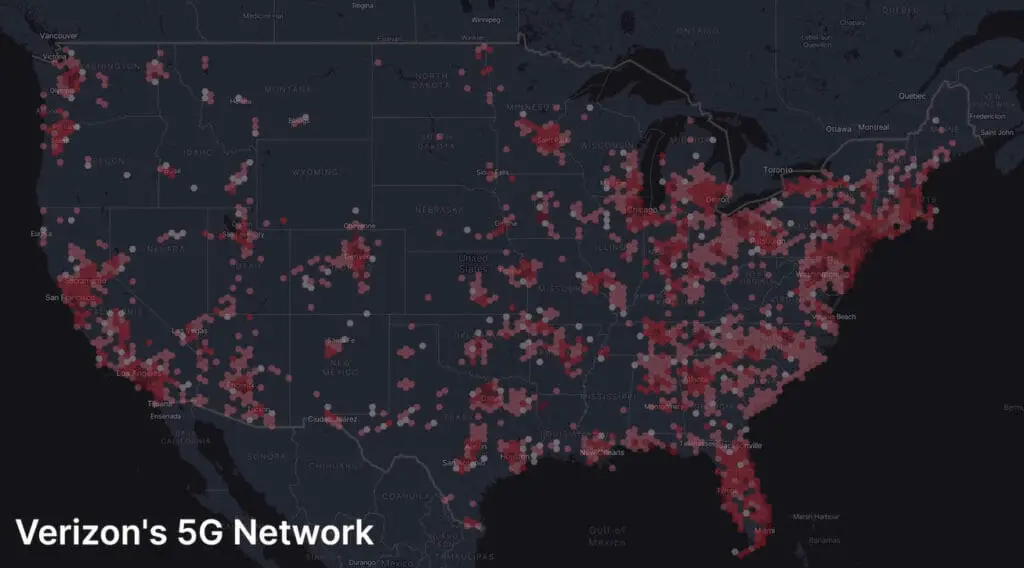
- Verizon. They’re a powerhouse in the telecom world with coverage across 70% of the country. This means they’ve covered most areas, from bustling cities to remote rural locations.
- AT&T. AT&T has made significant strides in extending its network across America. They cover approximately 68% of the U.S., making them a close second to Verizon.

- T-Mobile. While T-Mobile’s coverage isn’t as extensive as Verizon or AT&T, it’s still impressive at around 62%. Plus, they’re constantly working on expanding their coverage.
Here’s how each major US telecom providers stack up from one another:
| Carrier | Areas Covered | Percentage Coverage (U.S) |
|---|---|---|
| Verizon | Most areas, including cities and remote rural locations | 70% |
| AT&T | Extensive areas across America | 68% |
| T-Mobile | Major cities and expanding rural areas | 62% |
Accessing Telecom Coverage Maps
Official Websites
- Most telecom providers offer detailed coverage maps on their official websites. These are the most reliable sources as they come directly from the service providers.
Verizon
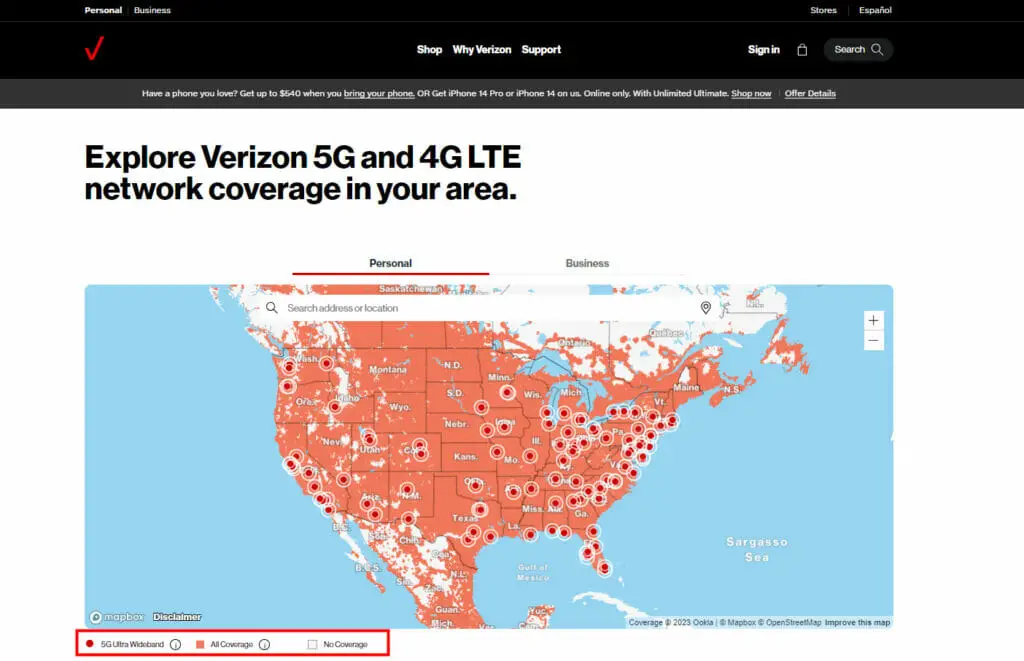
- Step 1: Navigate to Verizon’s official website.
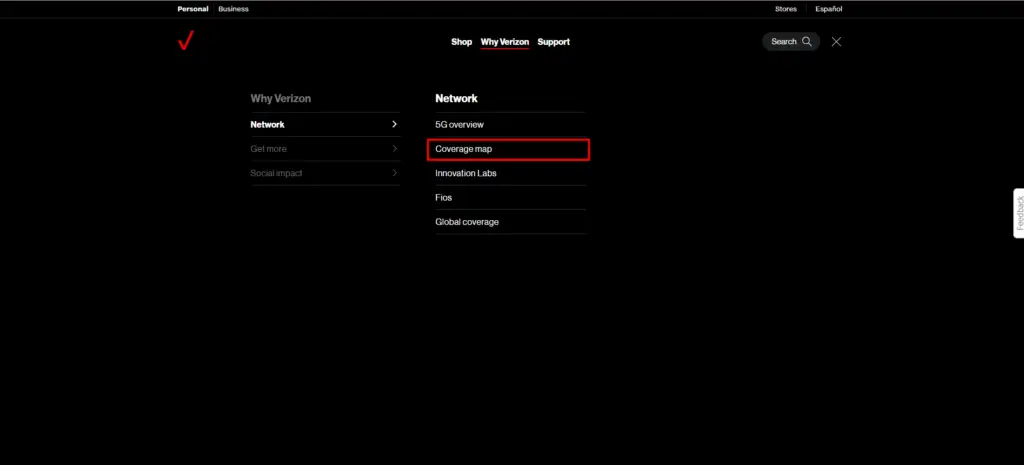
- Step 2: Click ‘Why Verizon’ and look for the “Network” section.
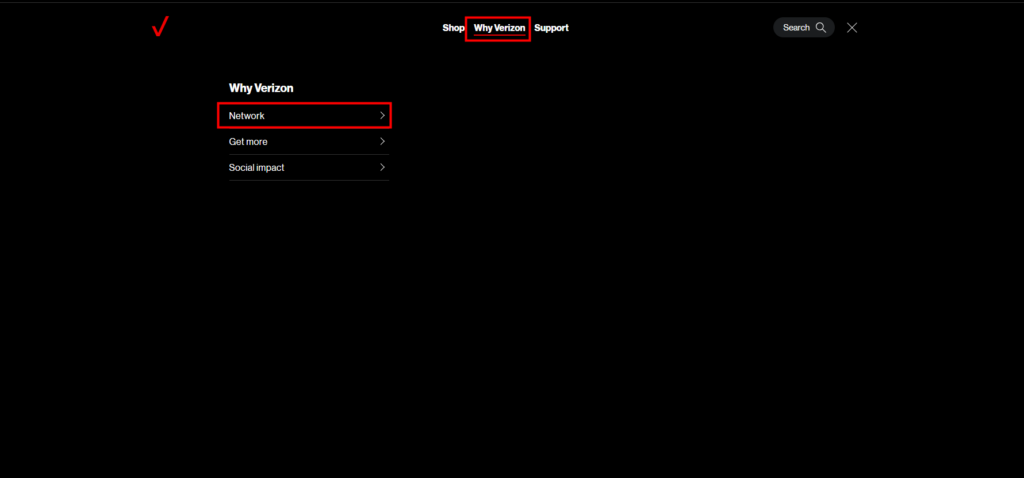
- Step 3: Tap on ‘Coverage Map.’
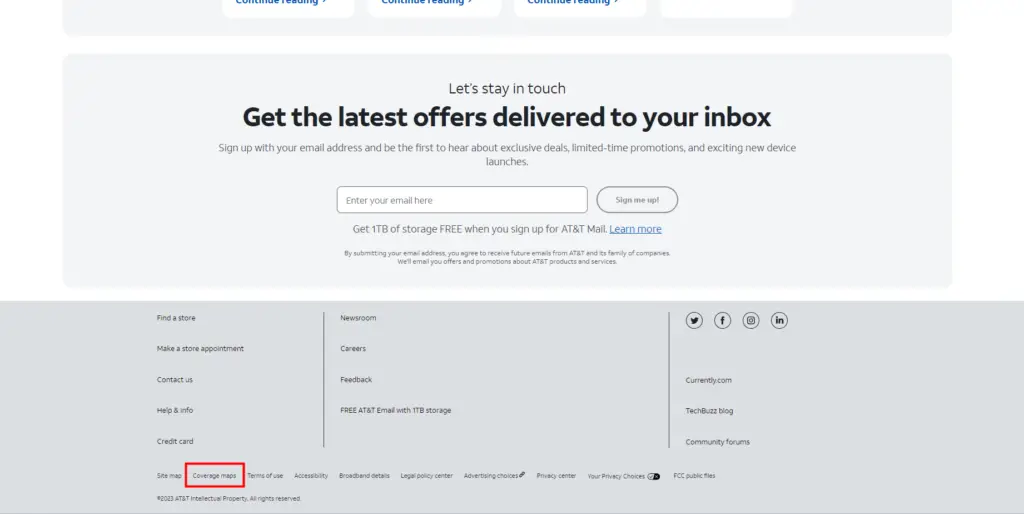
AT&T
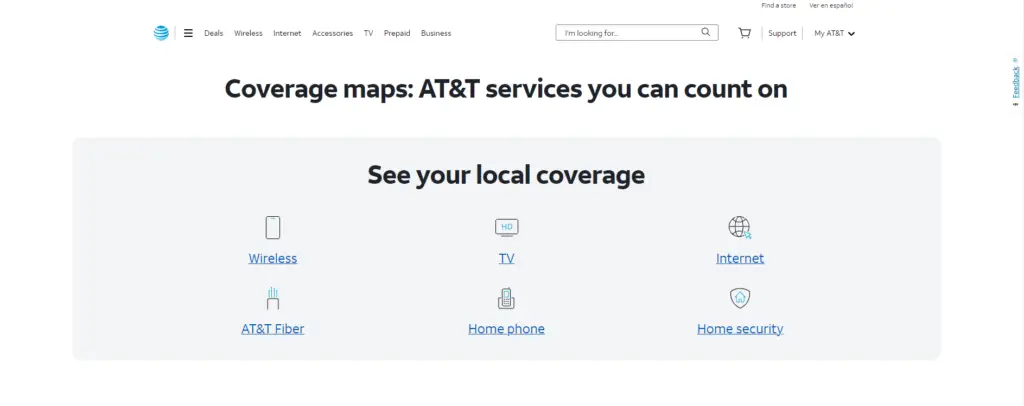
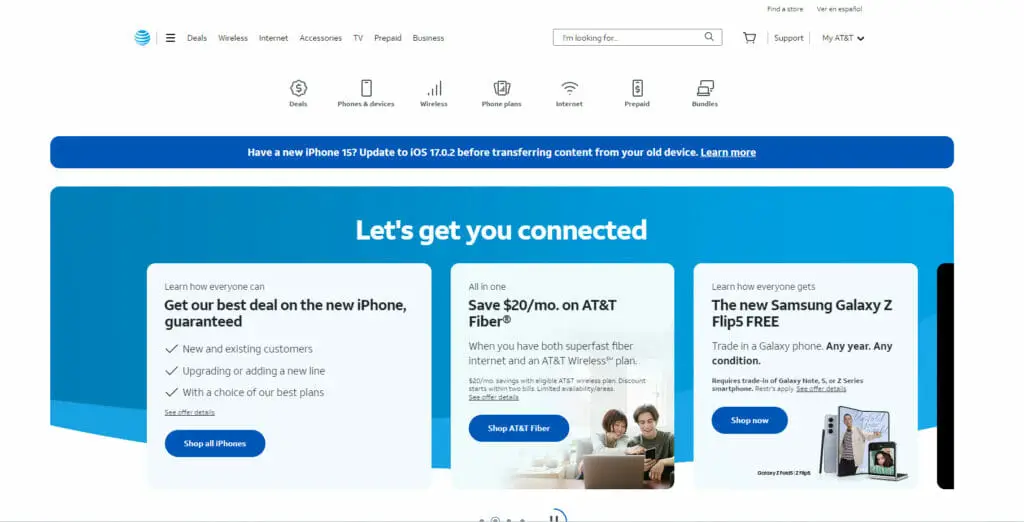
- Step 1: Navigate to Verizon’s official website.
- Step 2: Scroll to the bottom of the screen and click on ‘Coverage Maps.’
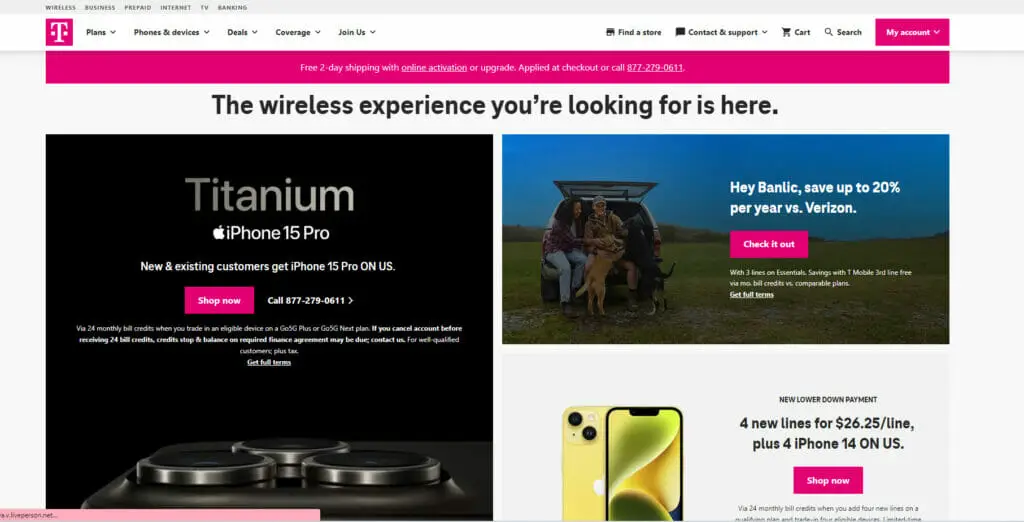
T-Mobile
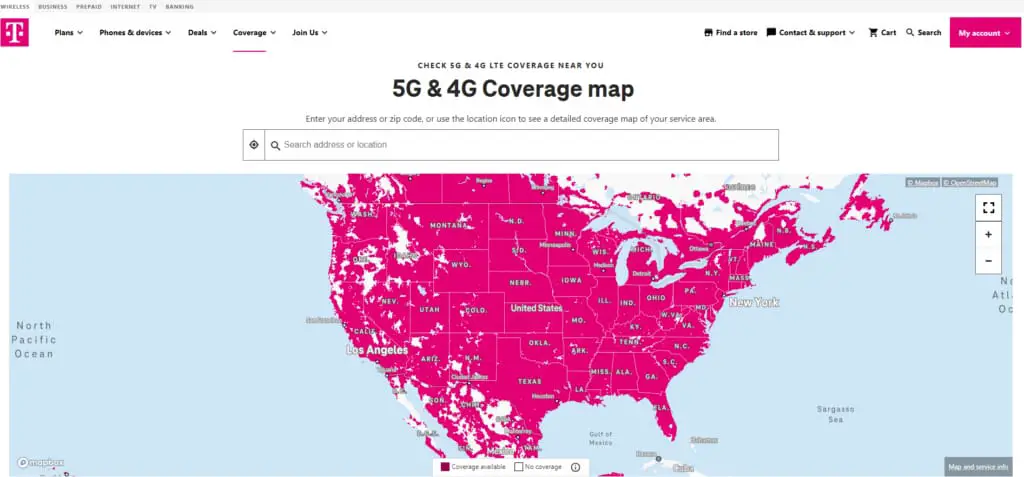
- Step 1: Head to T-Mobile’s site.
- Step 2: Select the “Coverage” tab.
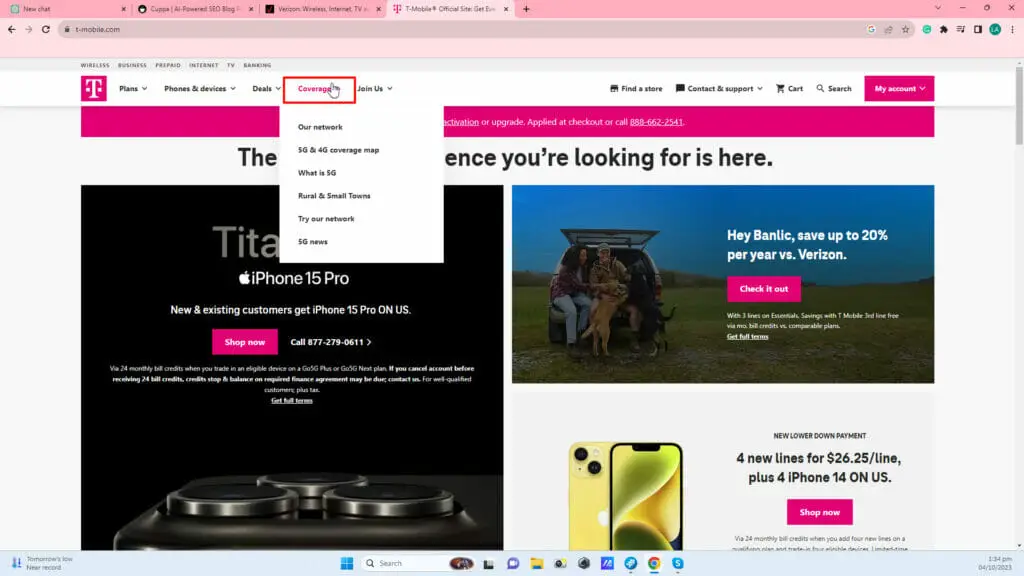
- Step 3: Click the “5G & 4G coverage map” tab.
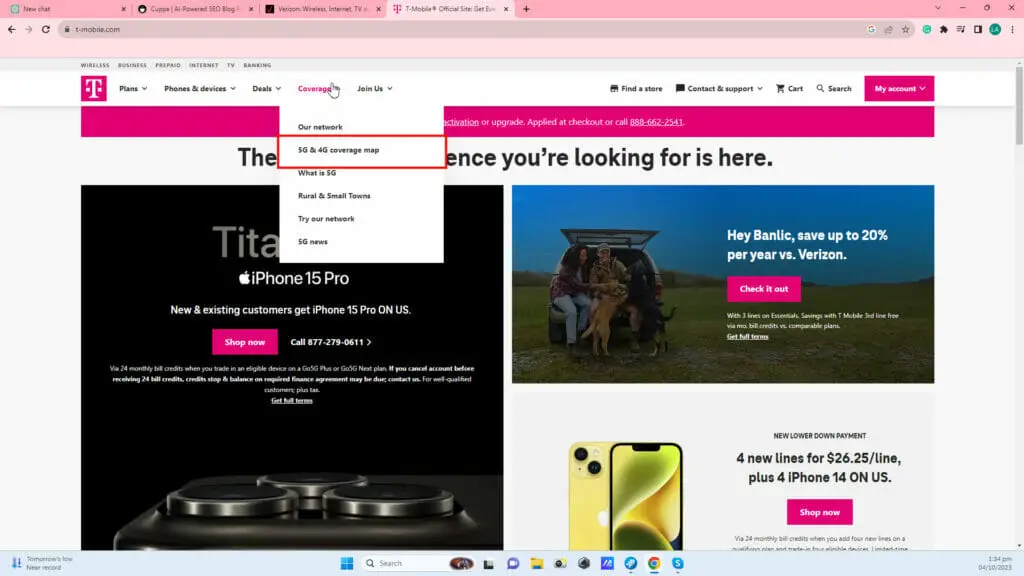
Tip: Make sure to enter your exact location for precise results.
Third-party Websites
Several websites aggregate and compare coverage data from various providers. Some popular ones include:
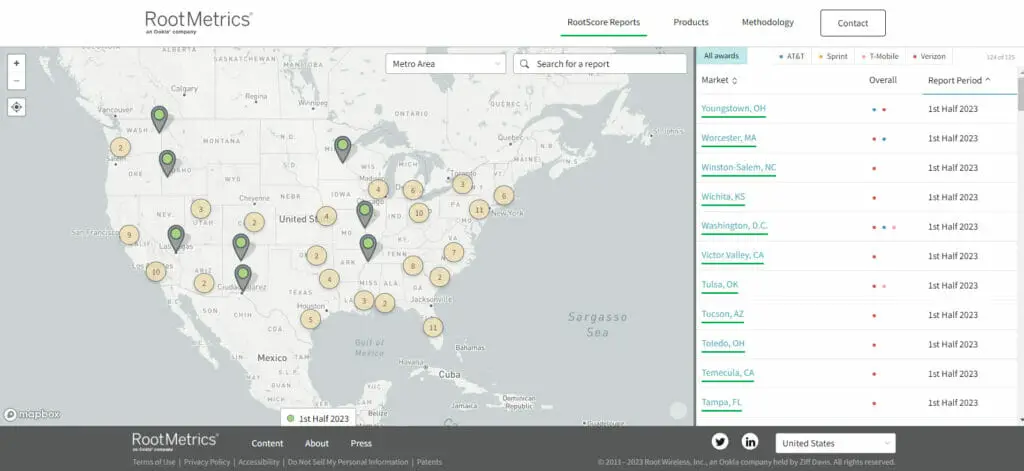
- RootMetrics: Offers coverage maps based on extensive drive testing.
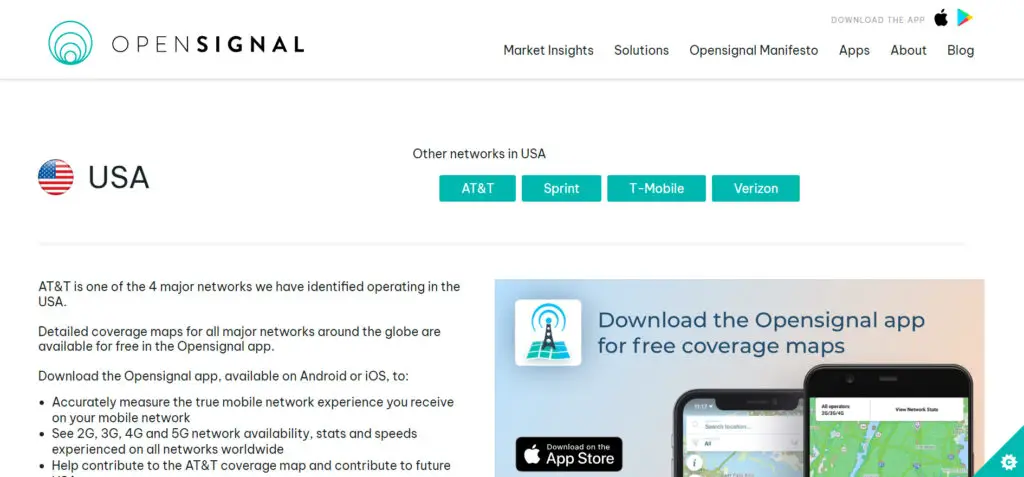
- OpenSignal: Uses crowd-sourced data from users’ devices to map coverage areas. The OpenSignal app is available for Android and iOS and visually represents coverage in various areas.
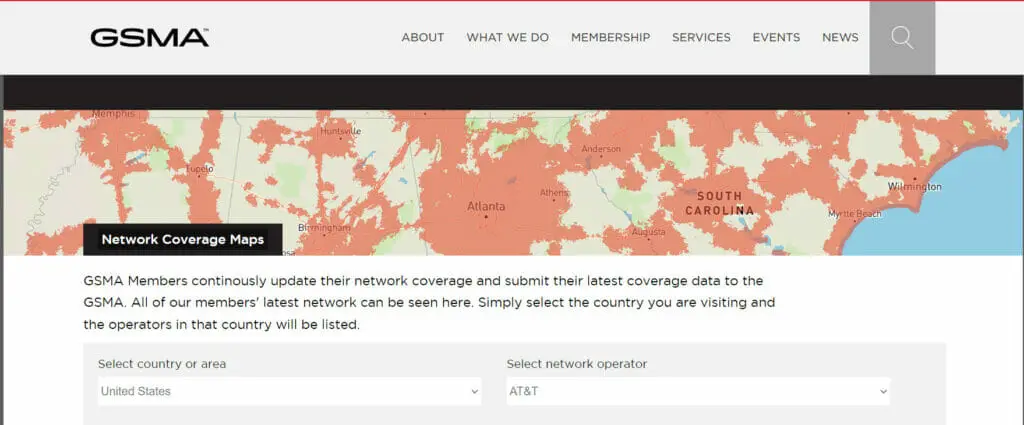
- GSMA: Offers comprehensive coverage maps on their website. At the same time, many of us are accustomed to checking individual mobile network operators for this data.
In-store Inquiries

- If you’re skeptical about online data or want a more personalized touch, consider visiting the physical store of a telecom provider. Representatives often have updated maps and can offer tailored advice based on your needs.
Using Coverage Maps for Decision-Making
Let’s talk coverage maps, shall we? They’re the unsung heroes of our mobile-driven lives. Have you ever been in the middle of nowhere and still managed to send that critical email? You have a coverage map to thank for that. But it’s not just about avoiding dead zones; these handy tools can be instrumental when deciding on a telecom provider.
- Coverage maps offer an overview of network reach. Check out a carrier’s map to know where their services are available. For instance, if you’re based in rural Montana but your carrier only offers robust service in urban areas like New York or San Francisco, some frustration will likely be involved.
Consider this:
| 4G Average Speed | 5G Average Speed | |
|---|---|---|
| AT&T | 25 Mbps | 60 Mbps |
| Verizon | 35 Mbps | 50 Mbps |
The above table indicates average speeds for two major providers’ 4G and 5G networks. If high-speed internet is what you’re after (and who isn’t?), these details could seriously sway your decision.
- Reliability. The best coverage map won’t mean much if the network isn’t reliable. Many maps include a ‘confidence’ rating based on user-reported data—these can help indicate how frequently users experience dropped calls or slow data speeds within covered areas.
- Cost-Efficiency. Access to comprehensive coverage information allows us to compare plans across carriers more accurately — no point paying extra for nationwide coverage if most of your time is spent within city limits!
Factors Influencing Coverage
Now, let’s delve into the factors that influence telecom coverage in the US. It’s not just about throwing up a bunch of cell towers and expecting perfect reception everywhere. There are quite a few variables at play here.
- Geographical terrain. Mountains, hills, valleys – they all impact signal strength. Even trees and buildings can interfere with signals, leading to patchy coverage in some areas. Here’s a quick rundown on how geography affects coverage:
- Mountains – block signals, creating “shadow zones” where reception is close to nil.
- Valleys – might get decent coverage or none, depending on their depth and width.
- Dense forests – can absorb radio waves, weakening the signal.
- Large buildings – especially those made of metal and concrete, also obstruct signals.
- Type of technology. For example, 4G networks provide wider coverage than 3G networks but aren’t as fast regarding data transfer speeds. The introduction of 5G networks promises faster speeds but has limited reach due to its high-frequency wave usage, which doesn’t travel as far as lower frequencies.
- Regulatory policies. Telecom companies also have to consider regulatory policies that govern where they can construct new cell towers or upgrade existing ones. These regulations vary from state to state and even city to city.
- Network Congestion. If too many people use the same network simultaneously – for instance, during big sports events or emergencies – you might experience slower speeds or dropped calls.
Future Projections
Peering into the future of US telecom coverage can be an exciting endeavor. We’re looking at a rapidly transforming landscape, with advancements in technology every day.
- 5G Network. The next generation wireless network. It’s not just about speed – it’s about massive connectivity. By 2025, I anticipate that nearly half of all mobile connections in the USA will be 5G. The good news doesn’t stop there; by 2030, we should see almost complete 5G penetration.
| Year | Expected 5G Coverage |
|---|---|
| 2025 | ~50% |
| 2030 | ~100% |
So what does this mean for us? With enhanced bandwidth and decreased latency, we’ll enjoy smoother video streaming experiences and real-time gaming – even in rural areas!
- Satellite Internet. Companies like Starlink are making huge strides to bring reliable internet to underserved regions of our country via satellites. If their projections are accurate (and I have reason to believe they are), by mid-2022, most parts of the United States will have access to satellite internet.
- Fiber Optics. Fiber optic technology offers superior speed and reliability compared to traditional broadband options. While only around 30% of Americans currently have access to fiber-optic internet services, as per FCC reports from late 2019, this number might double by the end of this decade.
Frequently Asked Questions
- Urban vs. Rural – who gets the better deal?
- Generally, urban areas have more coverage because of population density. But that doesn’t mean rural zones are left in the dust. Carriers are always working to boost their game everywhere!
- Do these maps show the quality or just coverage?
- Mainly coverage, but some maps have ‘confidence’ ratings based on user reports. It’s like seeing star reviews for your favorite DIY tool.
- I’ve got a 3G phone. Will I be left behind with all this 4G and 5G talk?
- Not to worry! While the world’s zooming with 4G and 5G, carriers still support 3G. But think about an upgrade for those snazzy new features down the road.
- Can I switch carriers if I’m not happy with my current coverage?
- Absolutely! Just ensure you check out any contractual ties with your current one. And hey, grab a coverage map of the new carrier before leaping.
- What about international roaming? Do the maps cover that?
- Most maps focus on domestic coverage, but carriers will also have info on international roaming. Before traveling, give them a call or check their site. It’s like packing an extra tool in your toolbox!
- Does the device I use impact my coverage?
- Sometimes! Newer devices might tap into advanced network features better than older ones. It’s always good to check if your device is fully compatible with your carrier’s offerings.
- Are there any ‘hidden’ spots known for great coverage?
- There might be spots in your city known for killer reception. Local forums or friends might have the inside scoop.
- Does the time of day affect my connection?
- It can! Peak hours might see more users, which can slow things down a smidge. It’s like morning traffic – sometimes you must wait a bit.
- Is the internet speed on these alternative networks comparable to the major carriers?
- For MVNOs, since they’re using the major carrier’s infrastructure, speeds should be comparable. However, during peak times or in congested areas, MVNO users might experience slower speeds as priority could be given to the primary carrier’s direct subscribers. Always check the provider’s terms and any potential speed restrictions.
References
Website Resources:
- T Mobile Official Website. https://www.t-mobile.com/
- Verizon Official Website. https://www.verizon.com/
- AT&T Official Website. https://www.att.com/
- GSMA. https://www.gsma.com/coverage/#107
- OpenSignal. https://www.opensignal.com/networks
- Root Metrics. https://www.rootmetrics.com/
Video References:
Stetson Doggett